ObserviQ is an intelligent observability platform designed to help engineering teams understand metrics, logs, alerts, and anomalies across distributed microservices through a clearer and more structured experience.
The project explores how observability data can move beyond isolated signals and become a more understandable representation of what's happening across an entire system.
My role
Web Developer
Project Stage
Completed
Project Duration
3 weeks
Completed at
2026
Toolkit
Figma Claude
The Challenge
How can complex observability data become easier to understand?
Modern applications generate huge amounts of technical data across metrics, logs, alerts, and anomalies. While existing observability platforms provide access to these signals, engineers still need to manually connect the dots to understand what is actually happening across their systems.
For ObserviQ, the challenge was to create an experience that could make these signals feel more connected, structured, and understandable.
Instead of presenting users with disconnected technical information, the goal was to create an interface that helps them move from raw signals → meaningful insights → better decisions.
The Solution
Turning fragmented system signals into a clearer experience
ObserviQ was designed as an intelligent middleware layer that brings different observability signals together and gives teams a more structured view of their systems.
The interface brings together: Metrics, Logs, Alerts, Anomalies, Analytics, Service-level insights
The dashboard was designed around a simple principle:
Show engineers what matters, when it matters.
Rather than overwhelming users with raw data, the interface creates clear hierarchy around active issues, system context, and actionable insights.
Visual Direction
Finding clarity inside complexity
The visual direction started from the nature of the problem itself.Observability tools can easily become dense and difficult to navigate because they deal with large amounts of technical information.
I wanted ObserviQ to feel different.
The design direction focused on:
Clarity
Reducing unnecessary visual noise and making important information easy to identify.Structure
Creating a consistent visual hierarchy across metrics, logs, alerts, and insights.Precision
Using typography, spacing, cards, and data visualisation to communicate technical information clearly.System thinking
Designing the interface as one connected ecosystem rather than a collection of separate screens.

Design System
Building a system for complex information
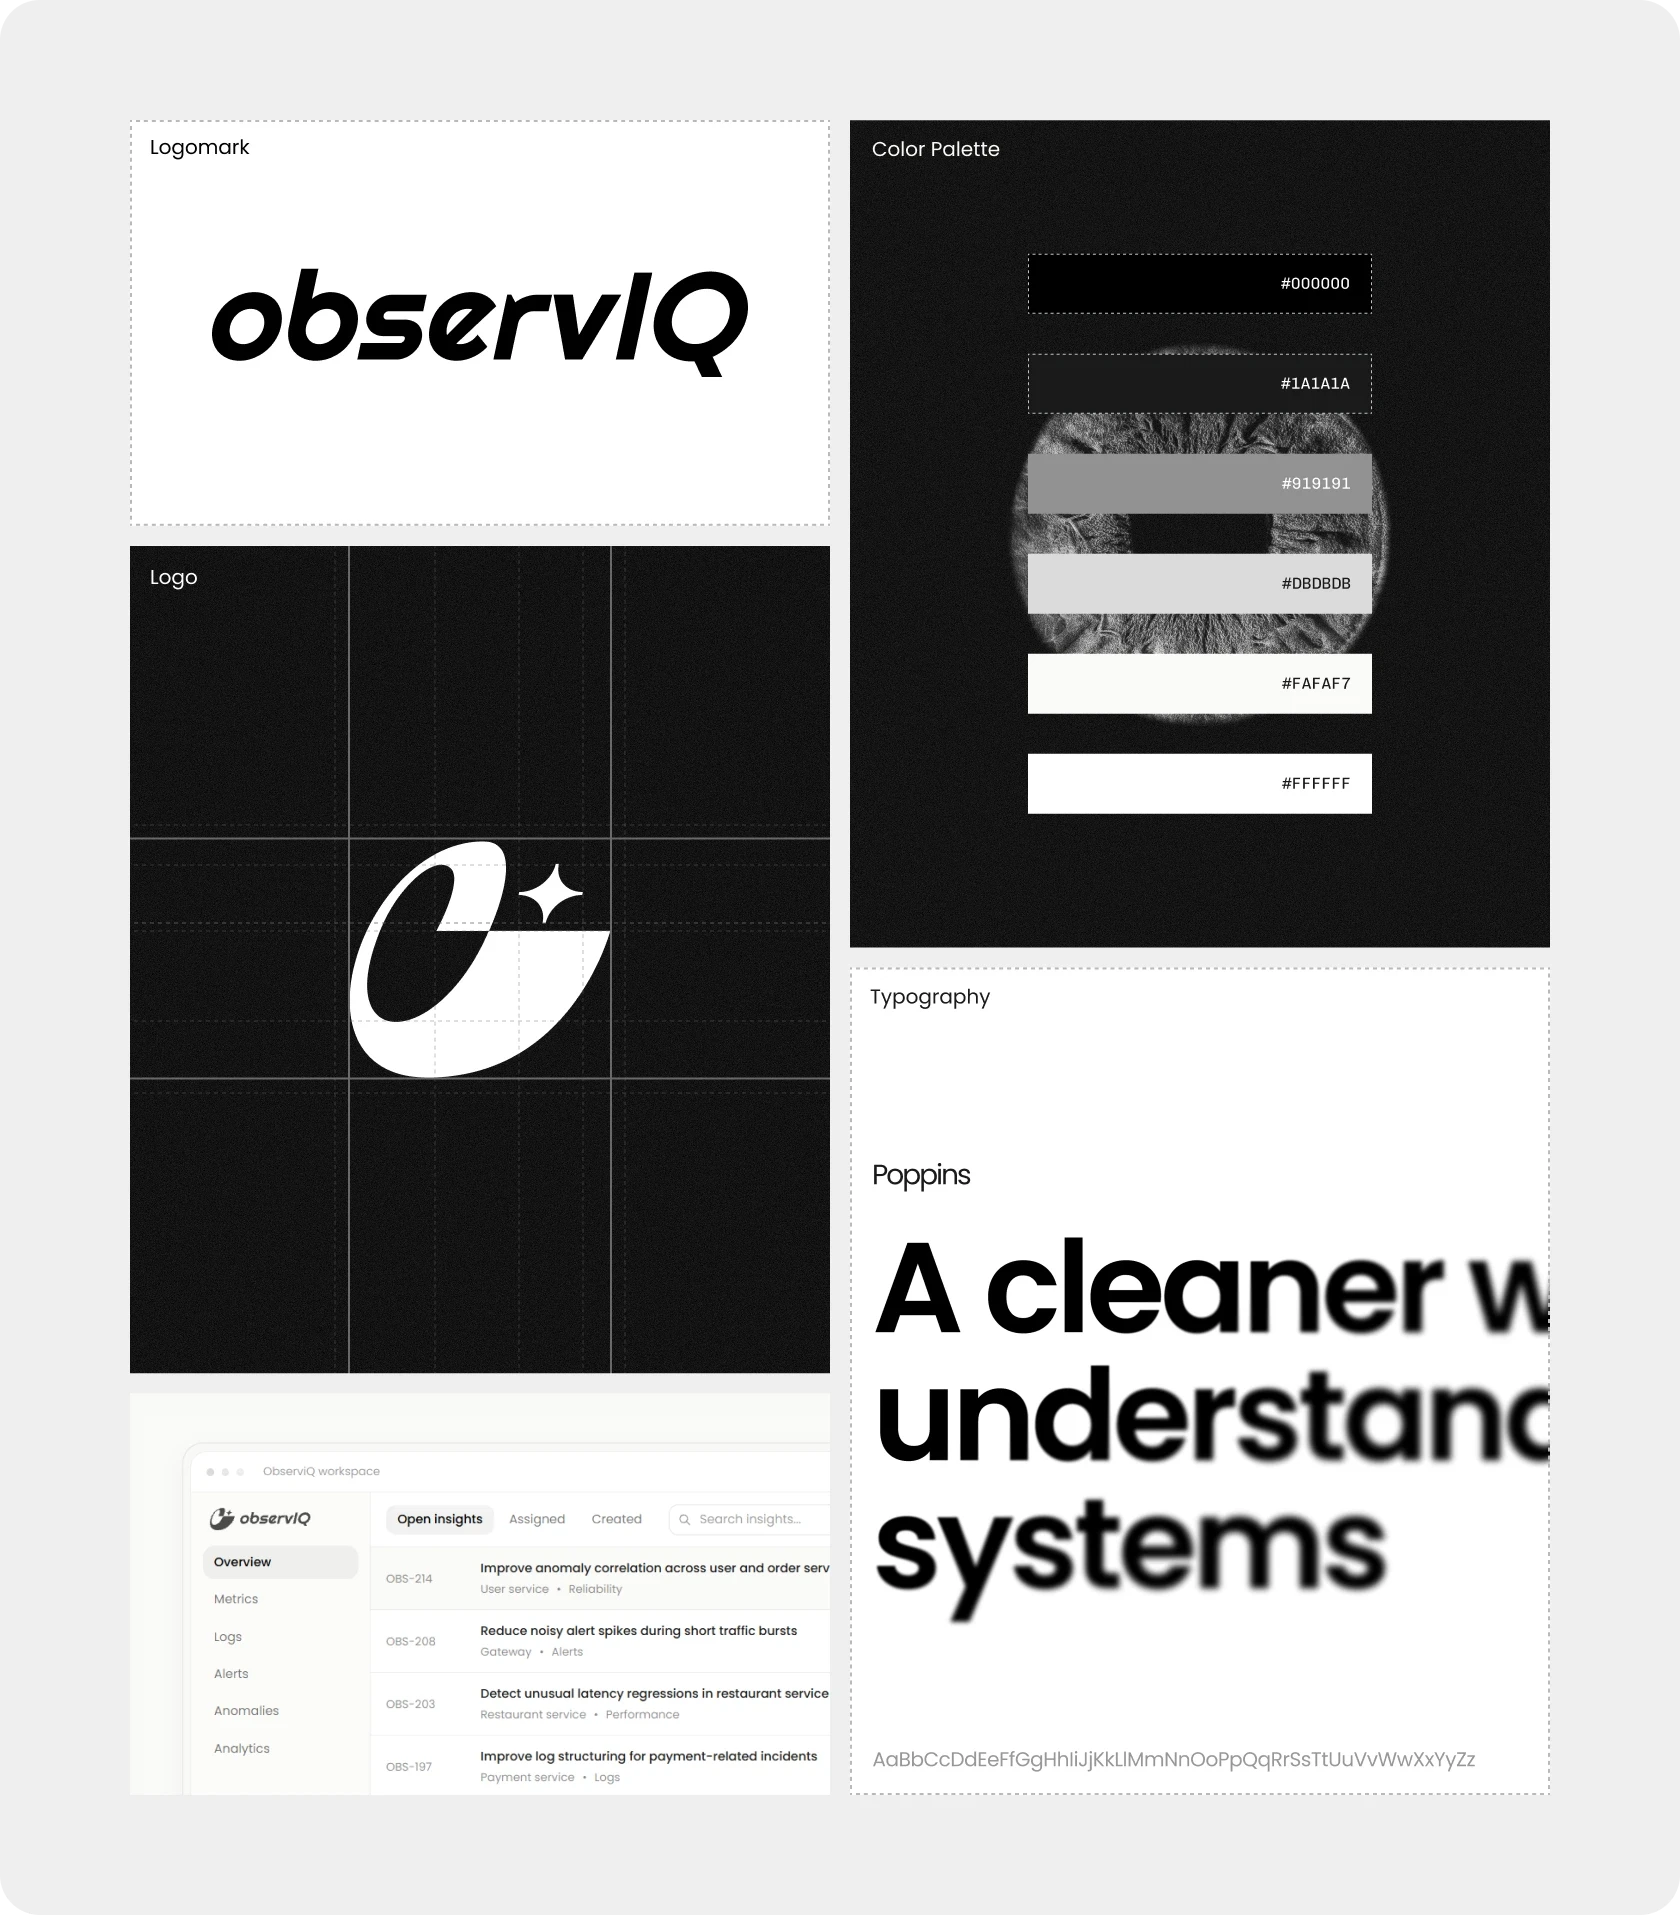
Because ObserviQ contains several different types of information, the interface needed a flexible design system.
I established reusable patterns for: Cards, Tables, Status indicators, Navigation, Metrics, Alerts, Data visualisations, Tags, Activity states, Buttons, Form elements
The system was designed around consistency so that users could quickly recognise patterns regardless of which part of the product they were using.
The goal wasn't to make every component visually impressive.
It was to make the information itself easier to understand.
UI Design
Designing the observability workspace
The dashboard became the central experience of ObserviQ.
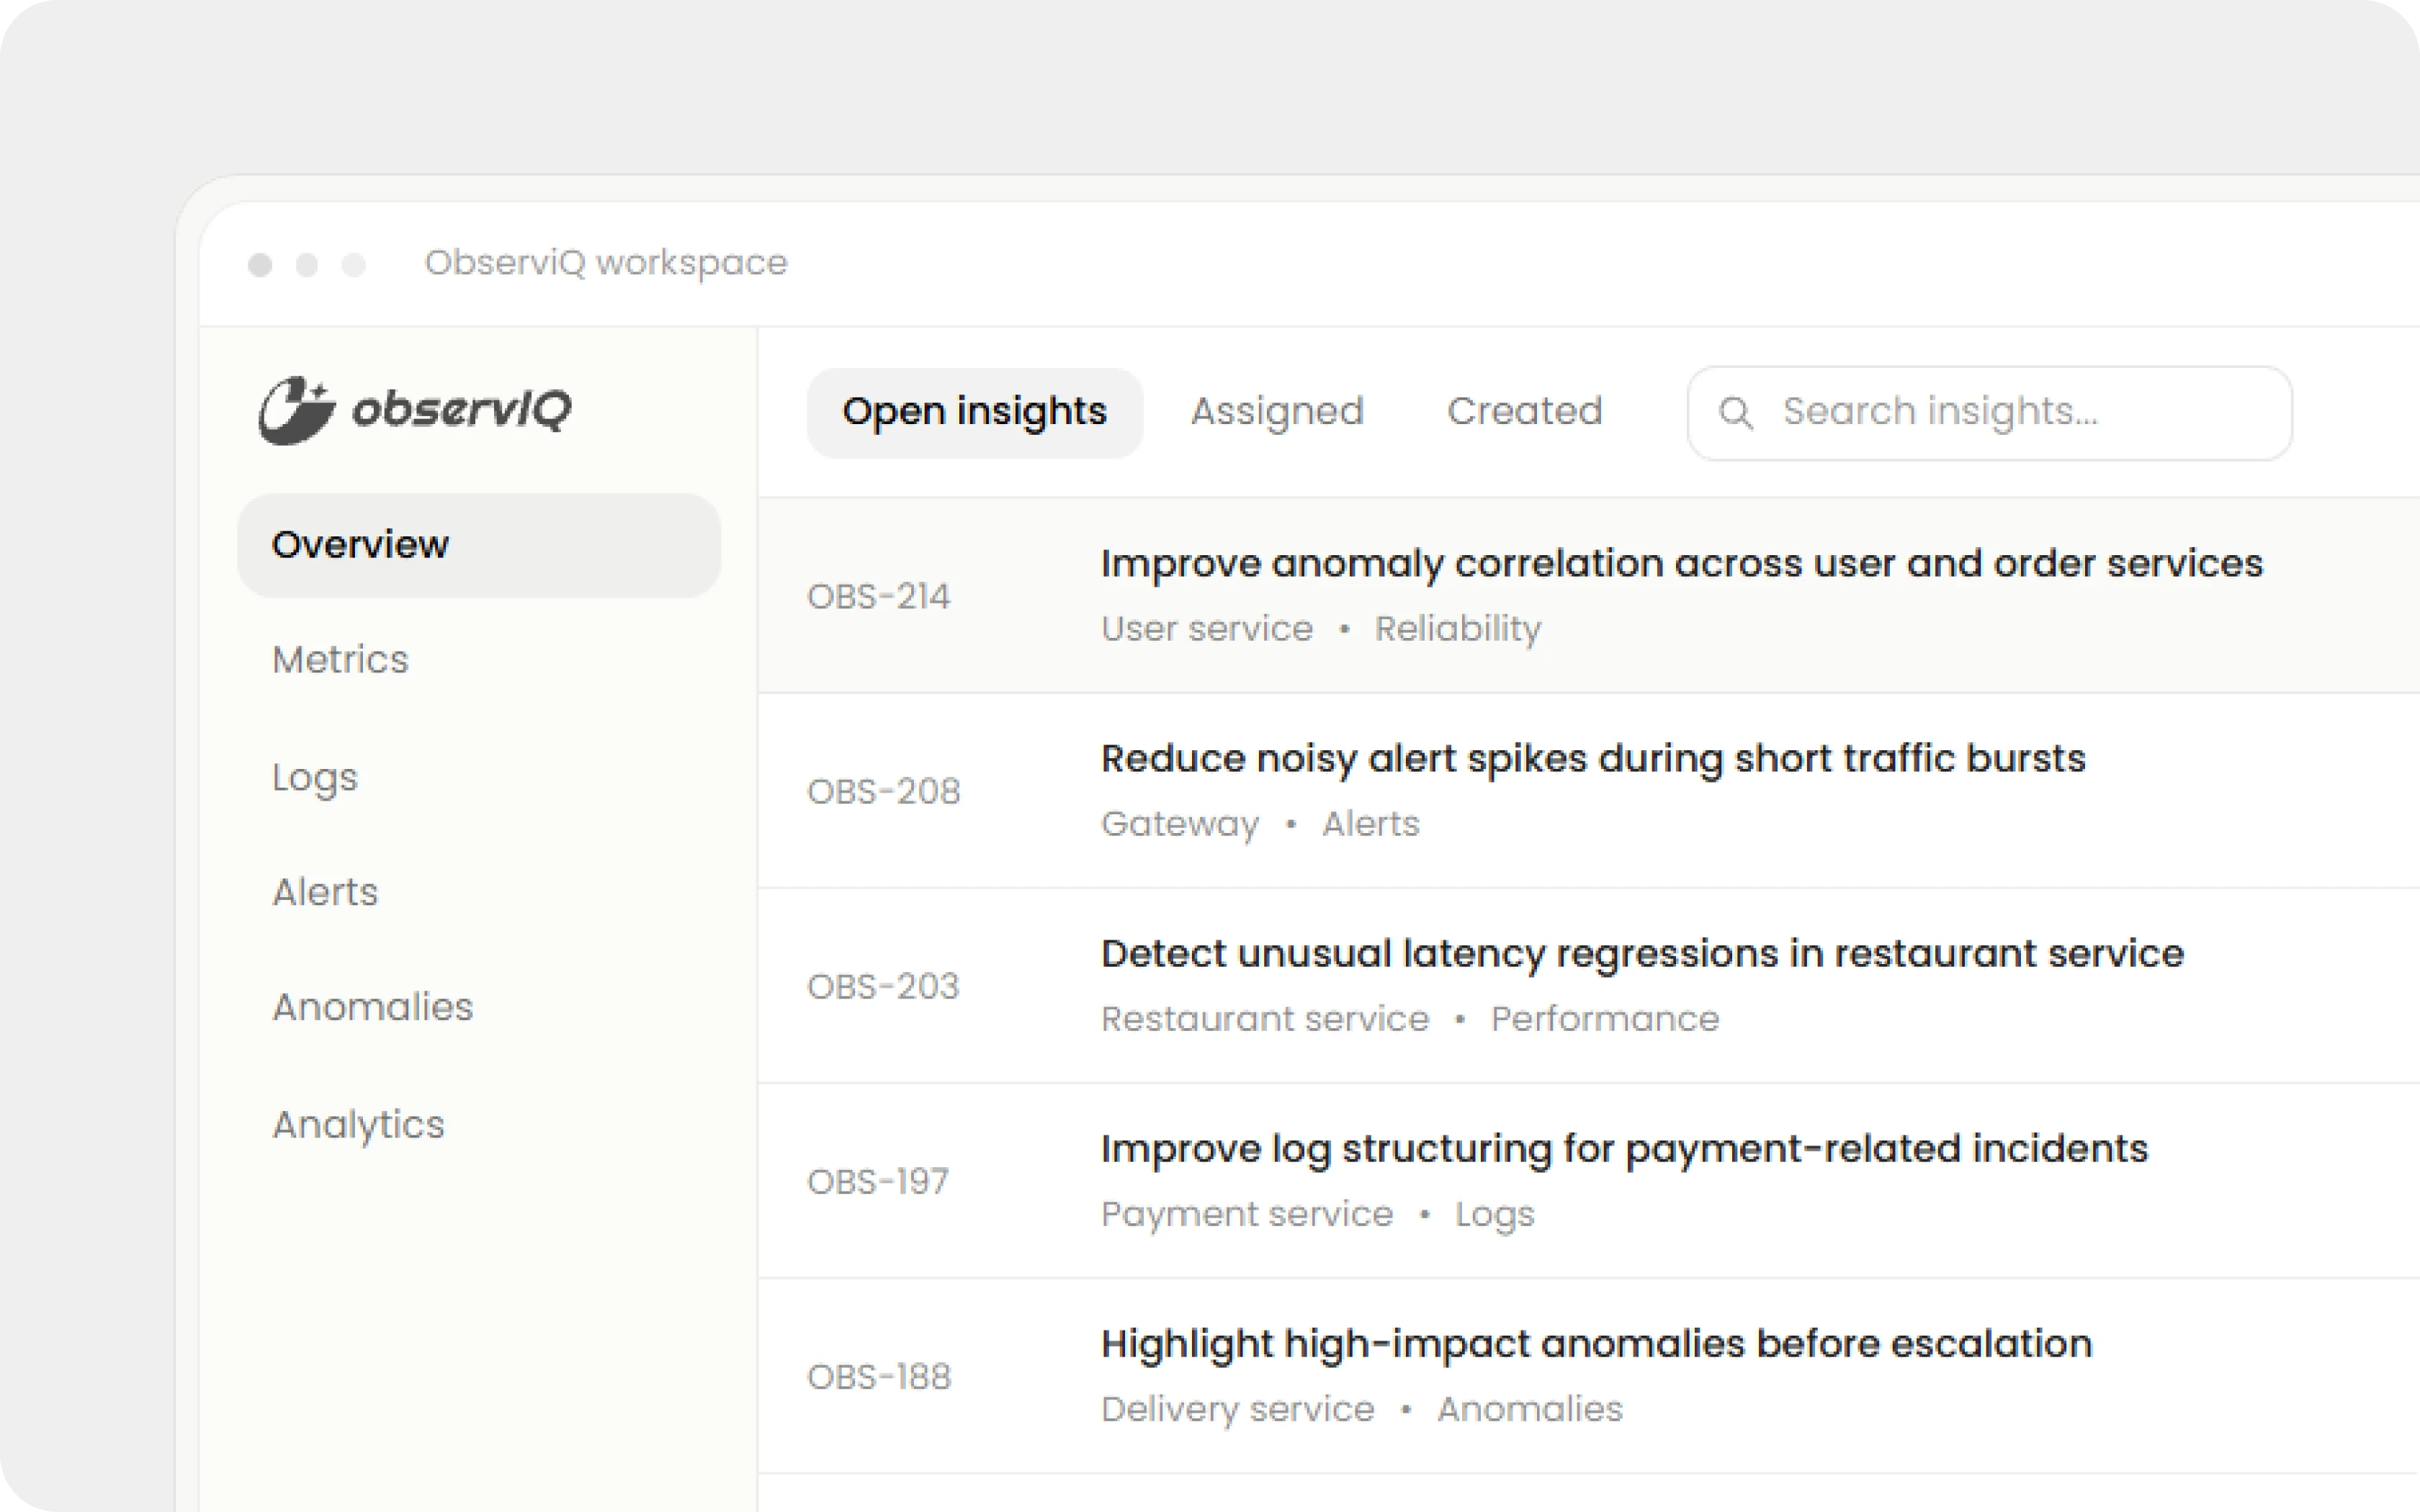
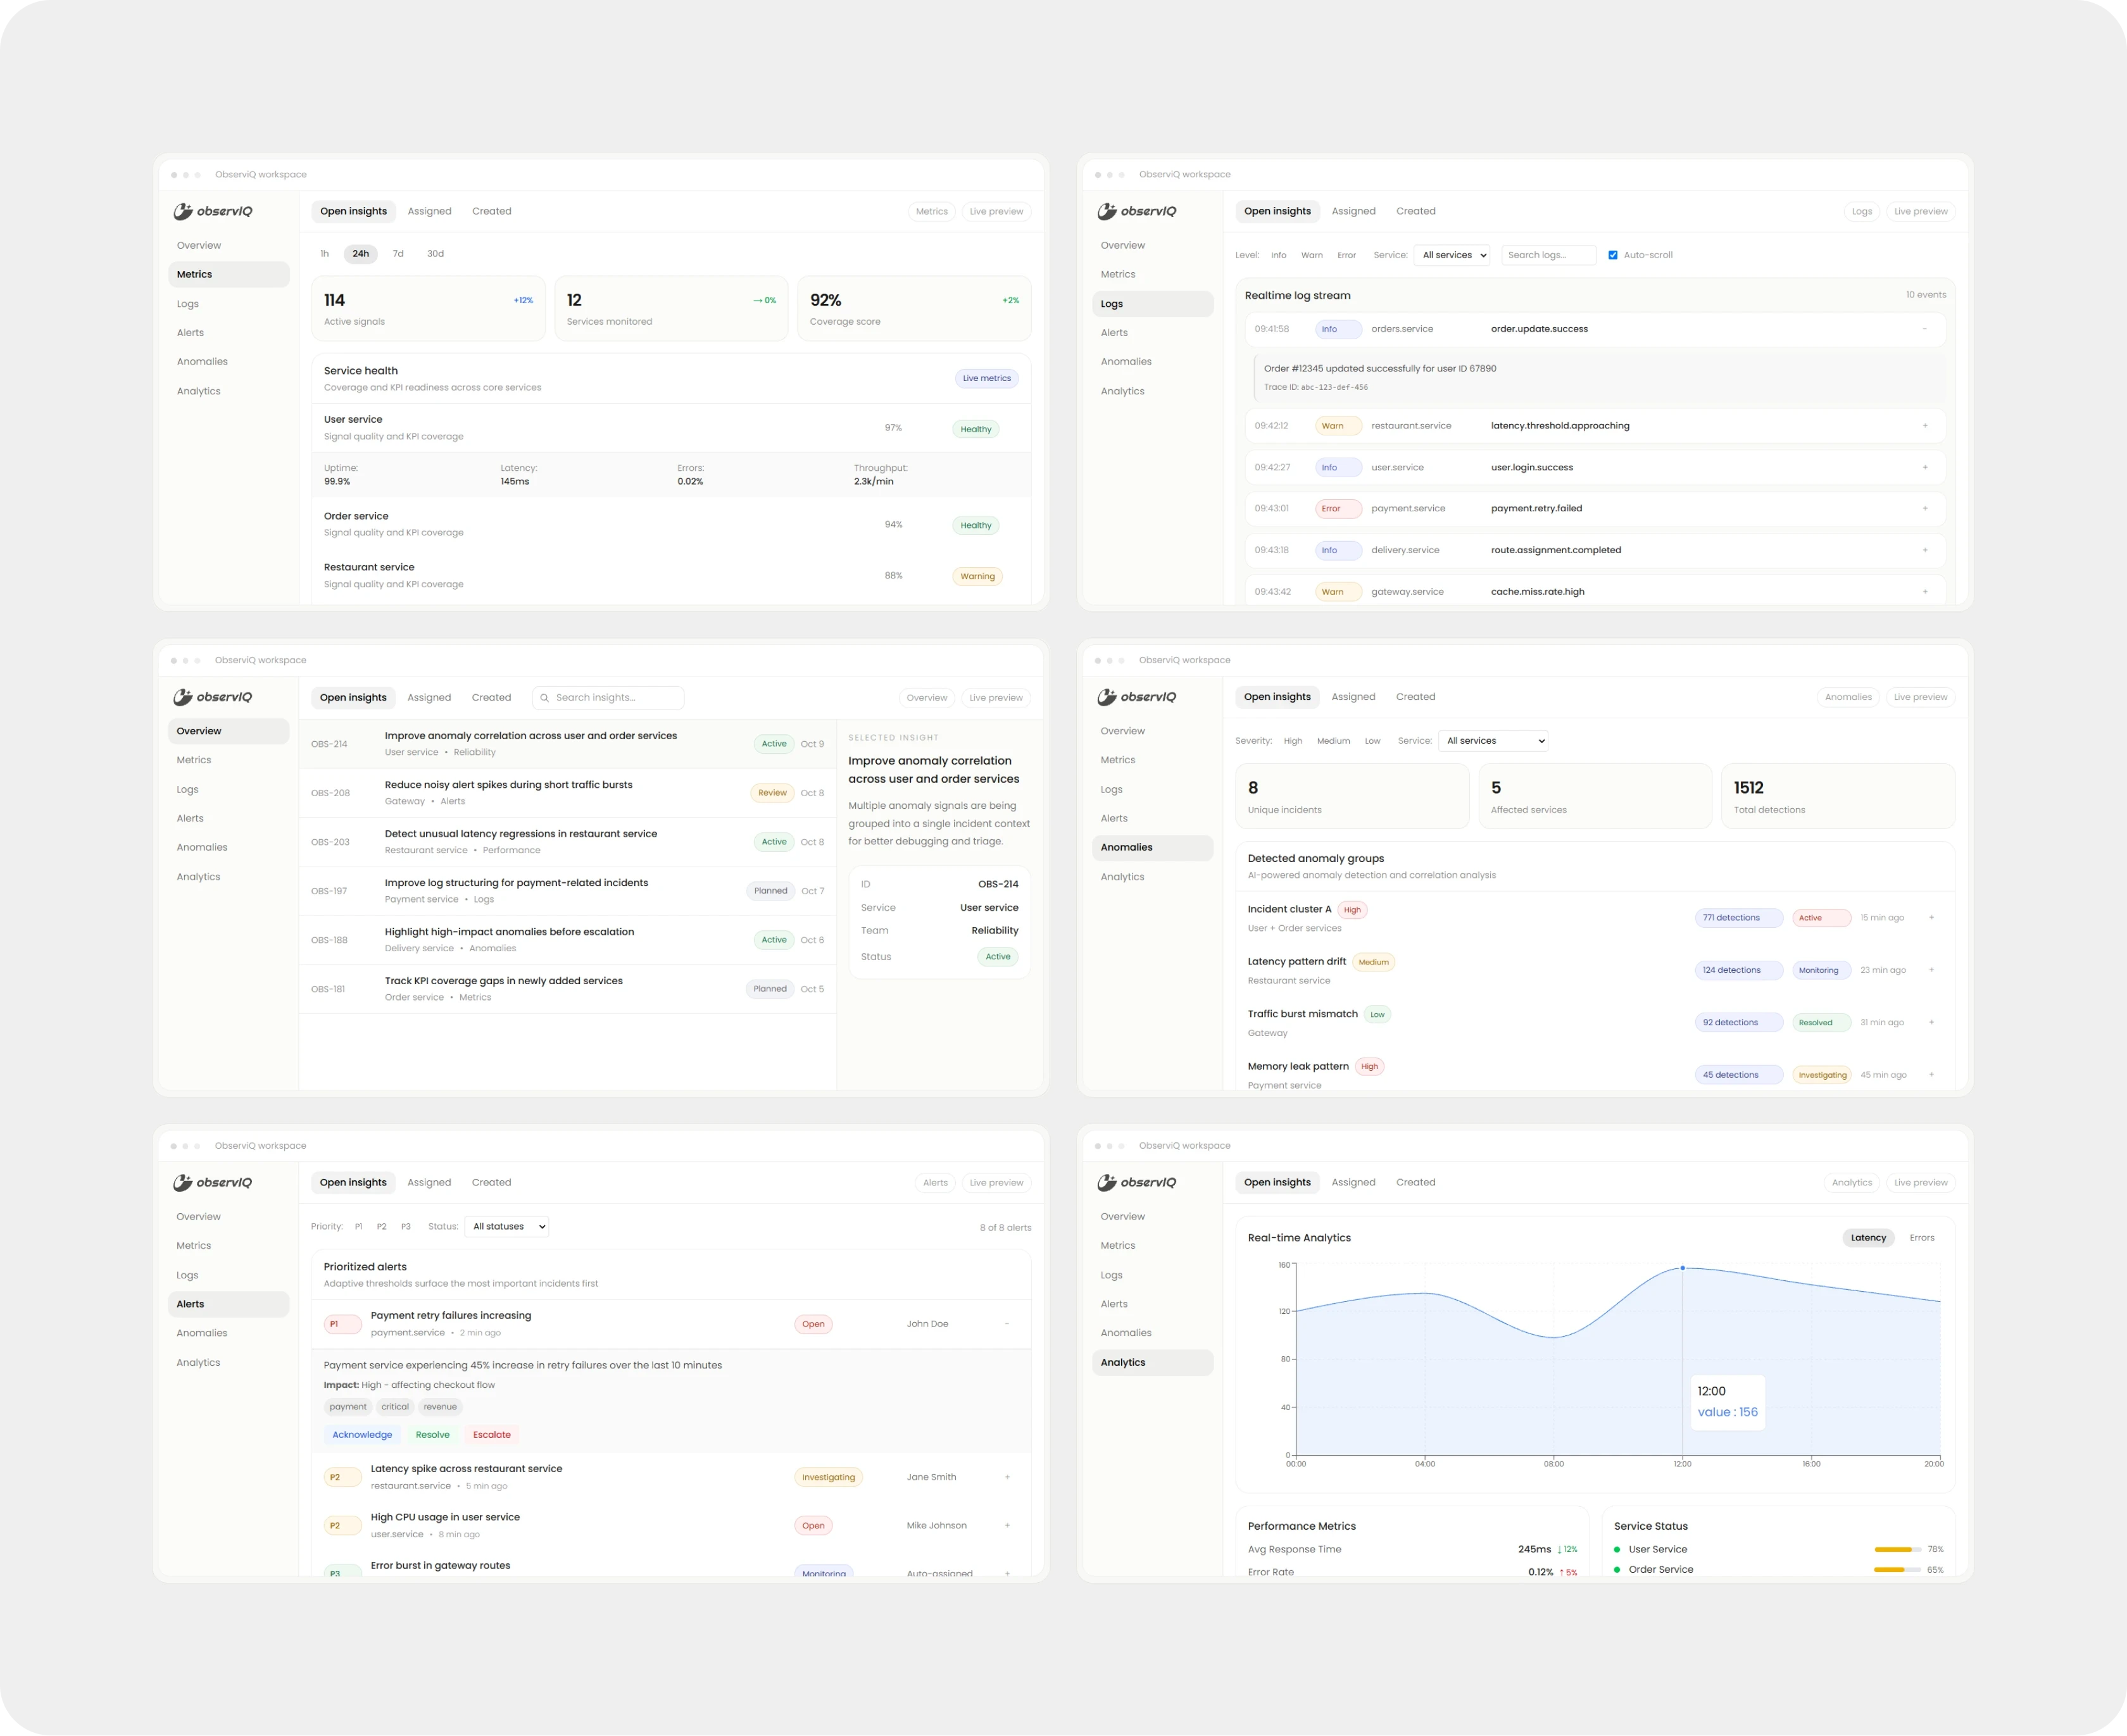
The main workspace provides access to: Overview · Metrics · Logs · Alerts · Anomalies · Analytics
The interface also surfaces active insights and system issues so users don't have to search through different areas to understand what's happening.
For example, an insight can connect multiple anomaly signals into a single incident context, helping engineers understand relationships between services rather than investigating each signal independently.
Information Architecture
I focused heavily on hierarchy within the dashboard.
The most important information receives the strongest visual emphasis, while supporting information is progressively reduced.
This creates a clear reading pattern:
System status → Active issue → Context → Details → Action
Core Experience
Structuring a complex technical product
ObserviQ is also a research-driven project, so the product experience needed to reflect the underlying research.
The project explores:
Existing observability platforms
Monitoring systems
Anomaly detection
Intelligent system interpretation
Multi-signal analysis
Service-level system modelling
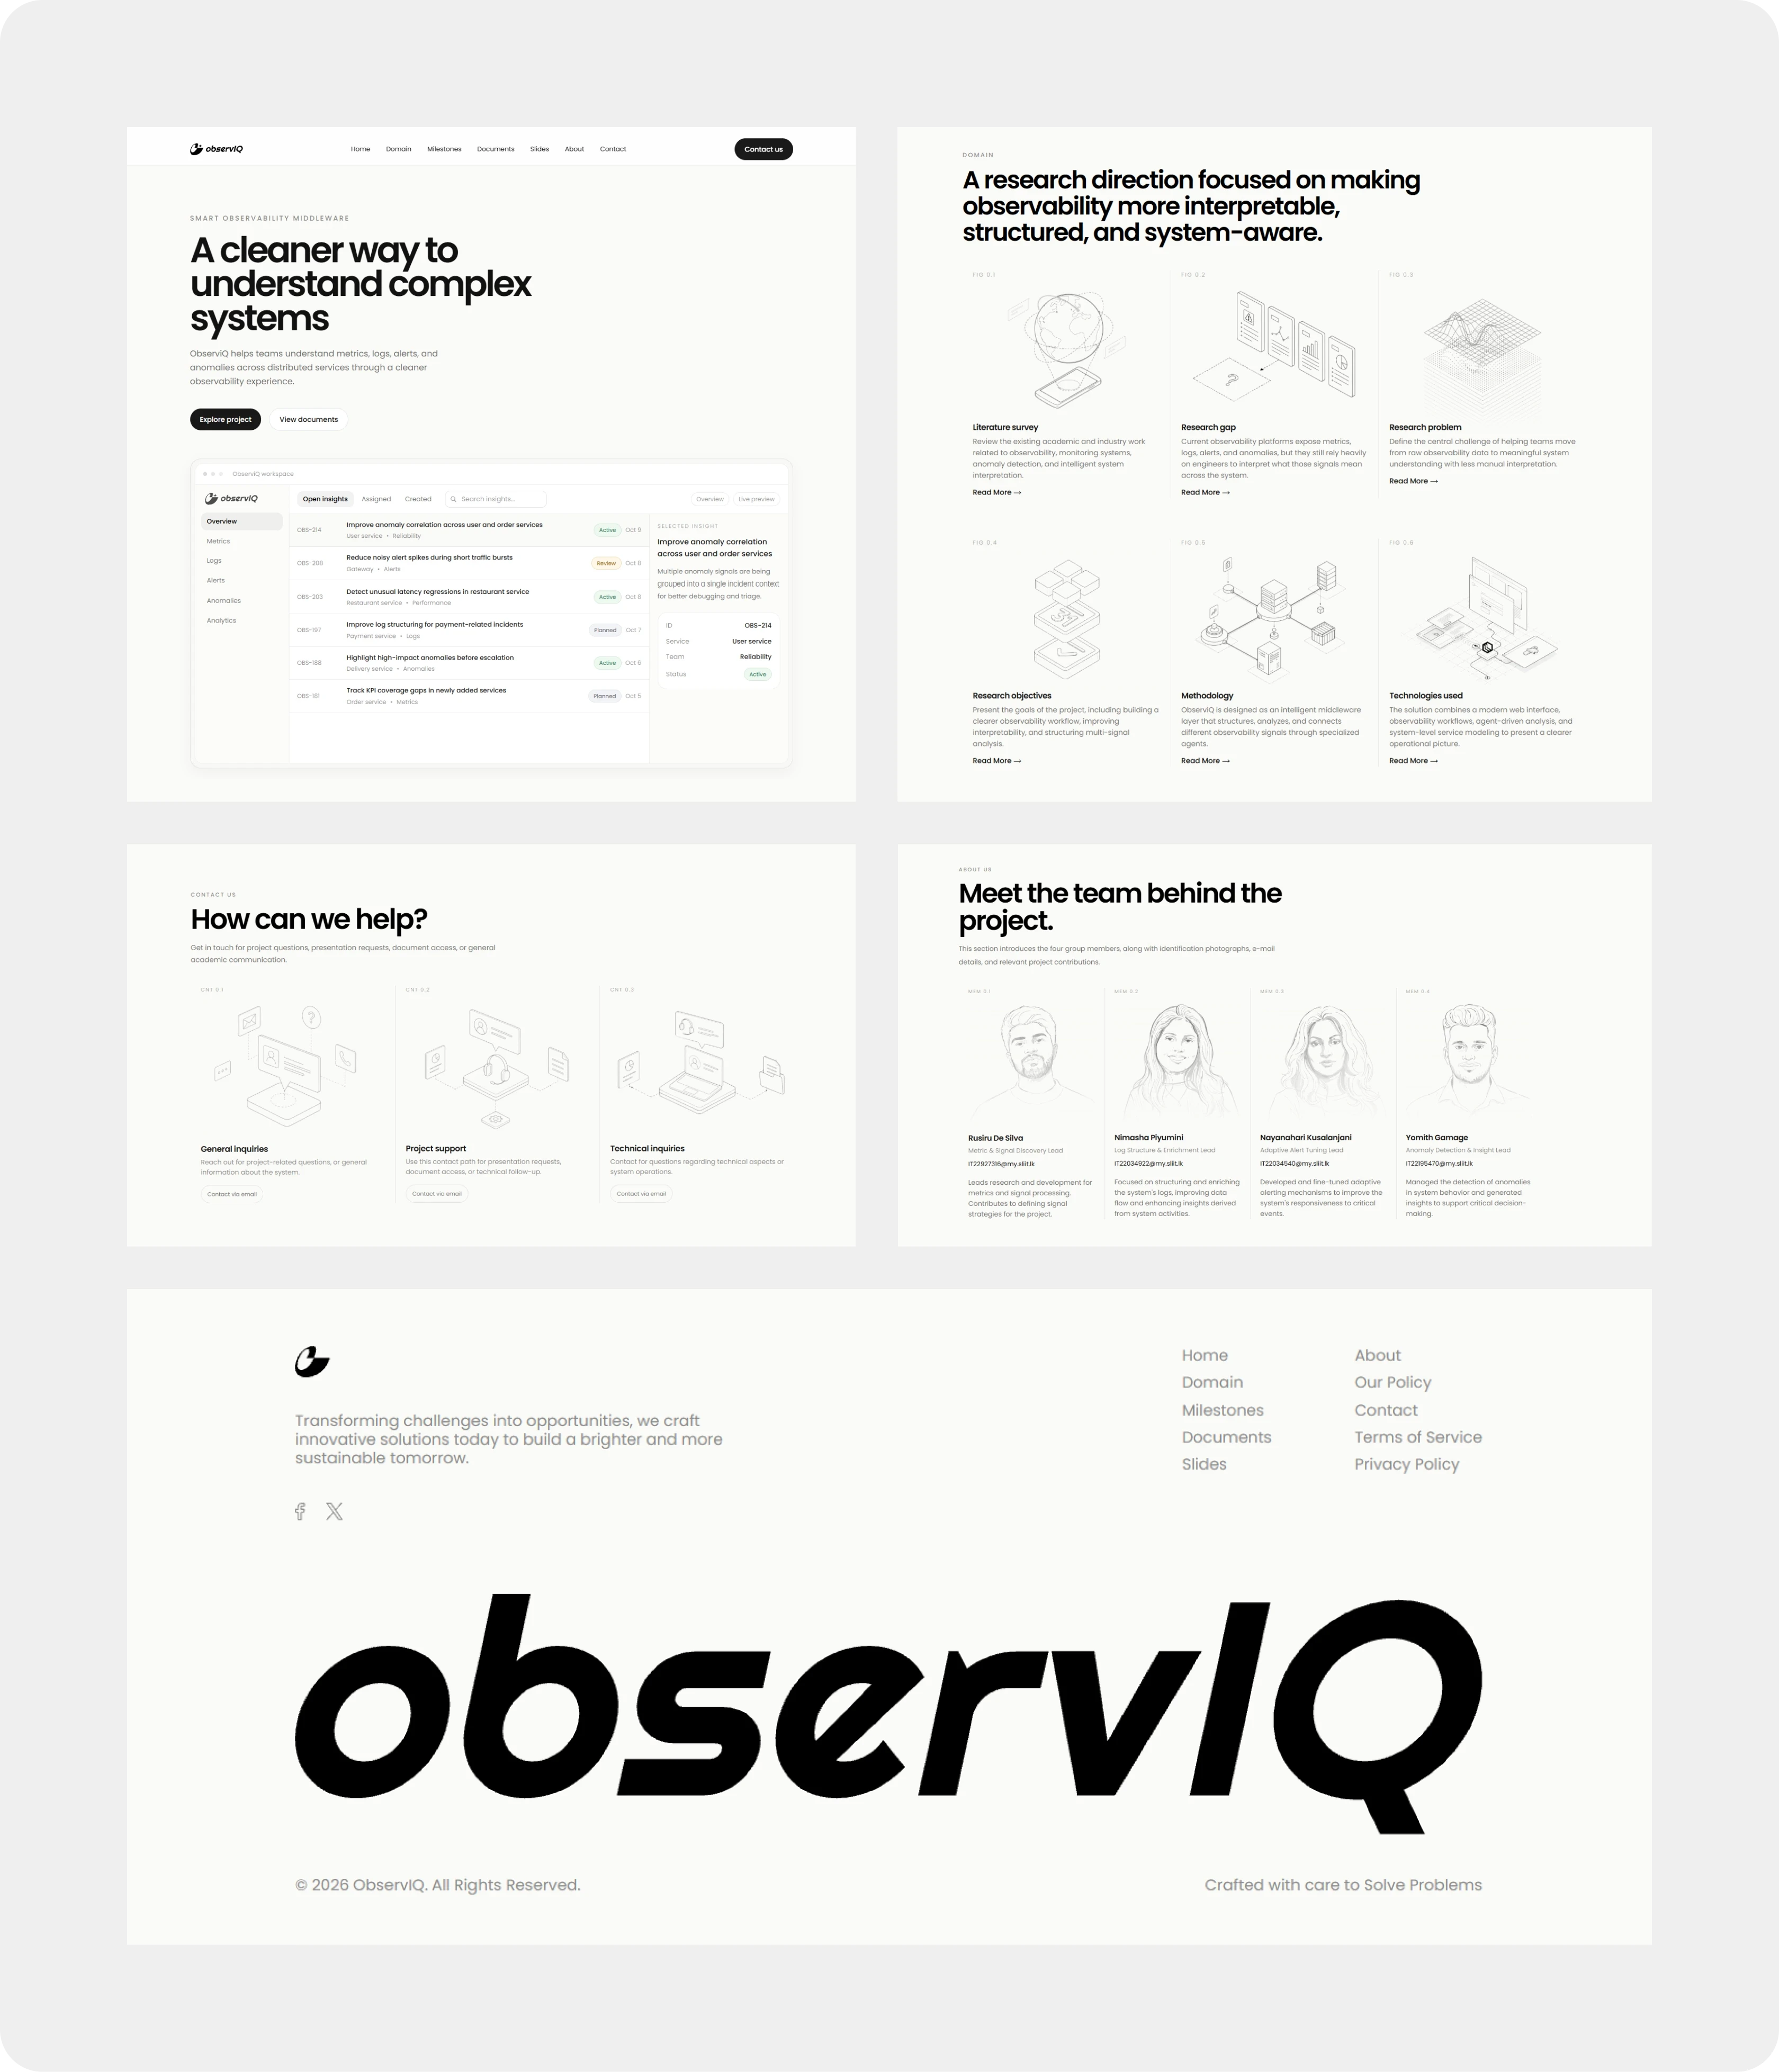
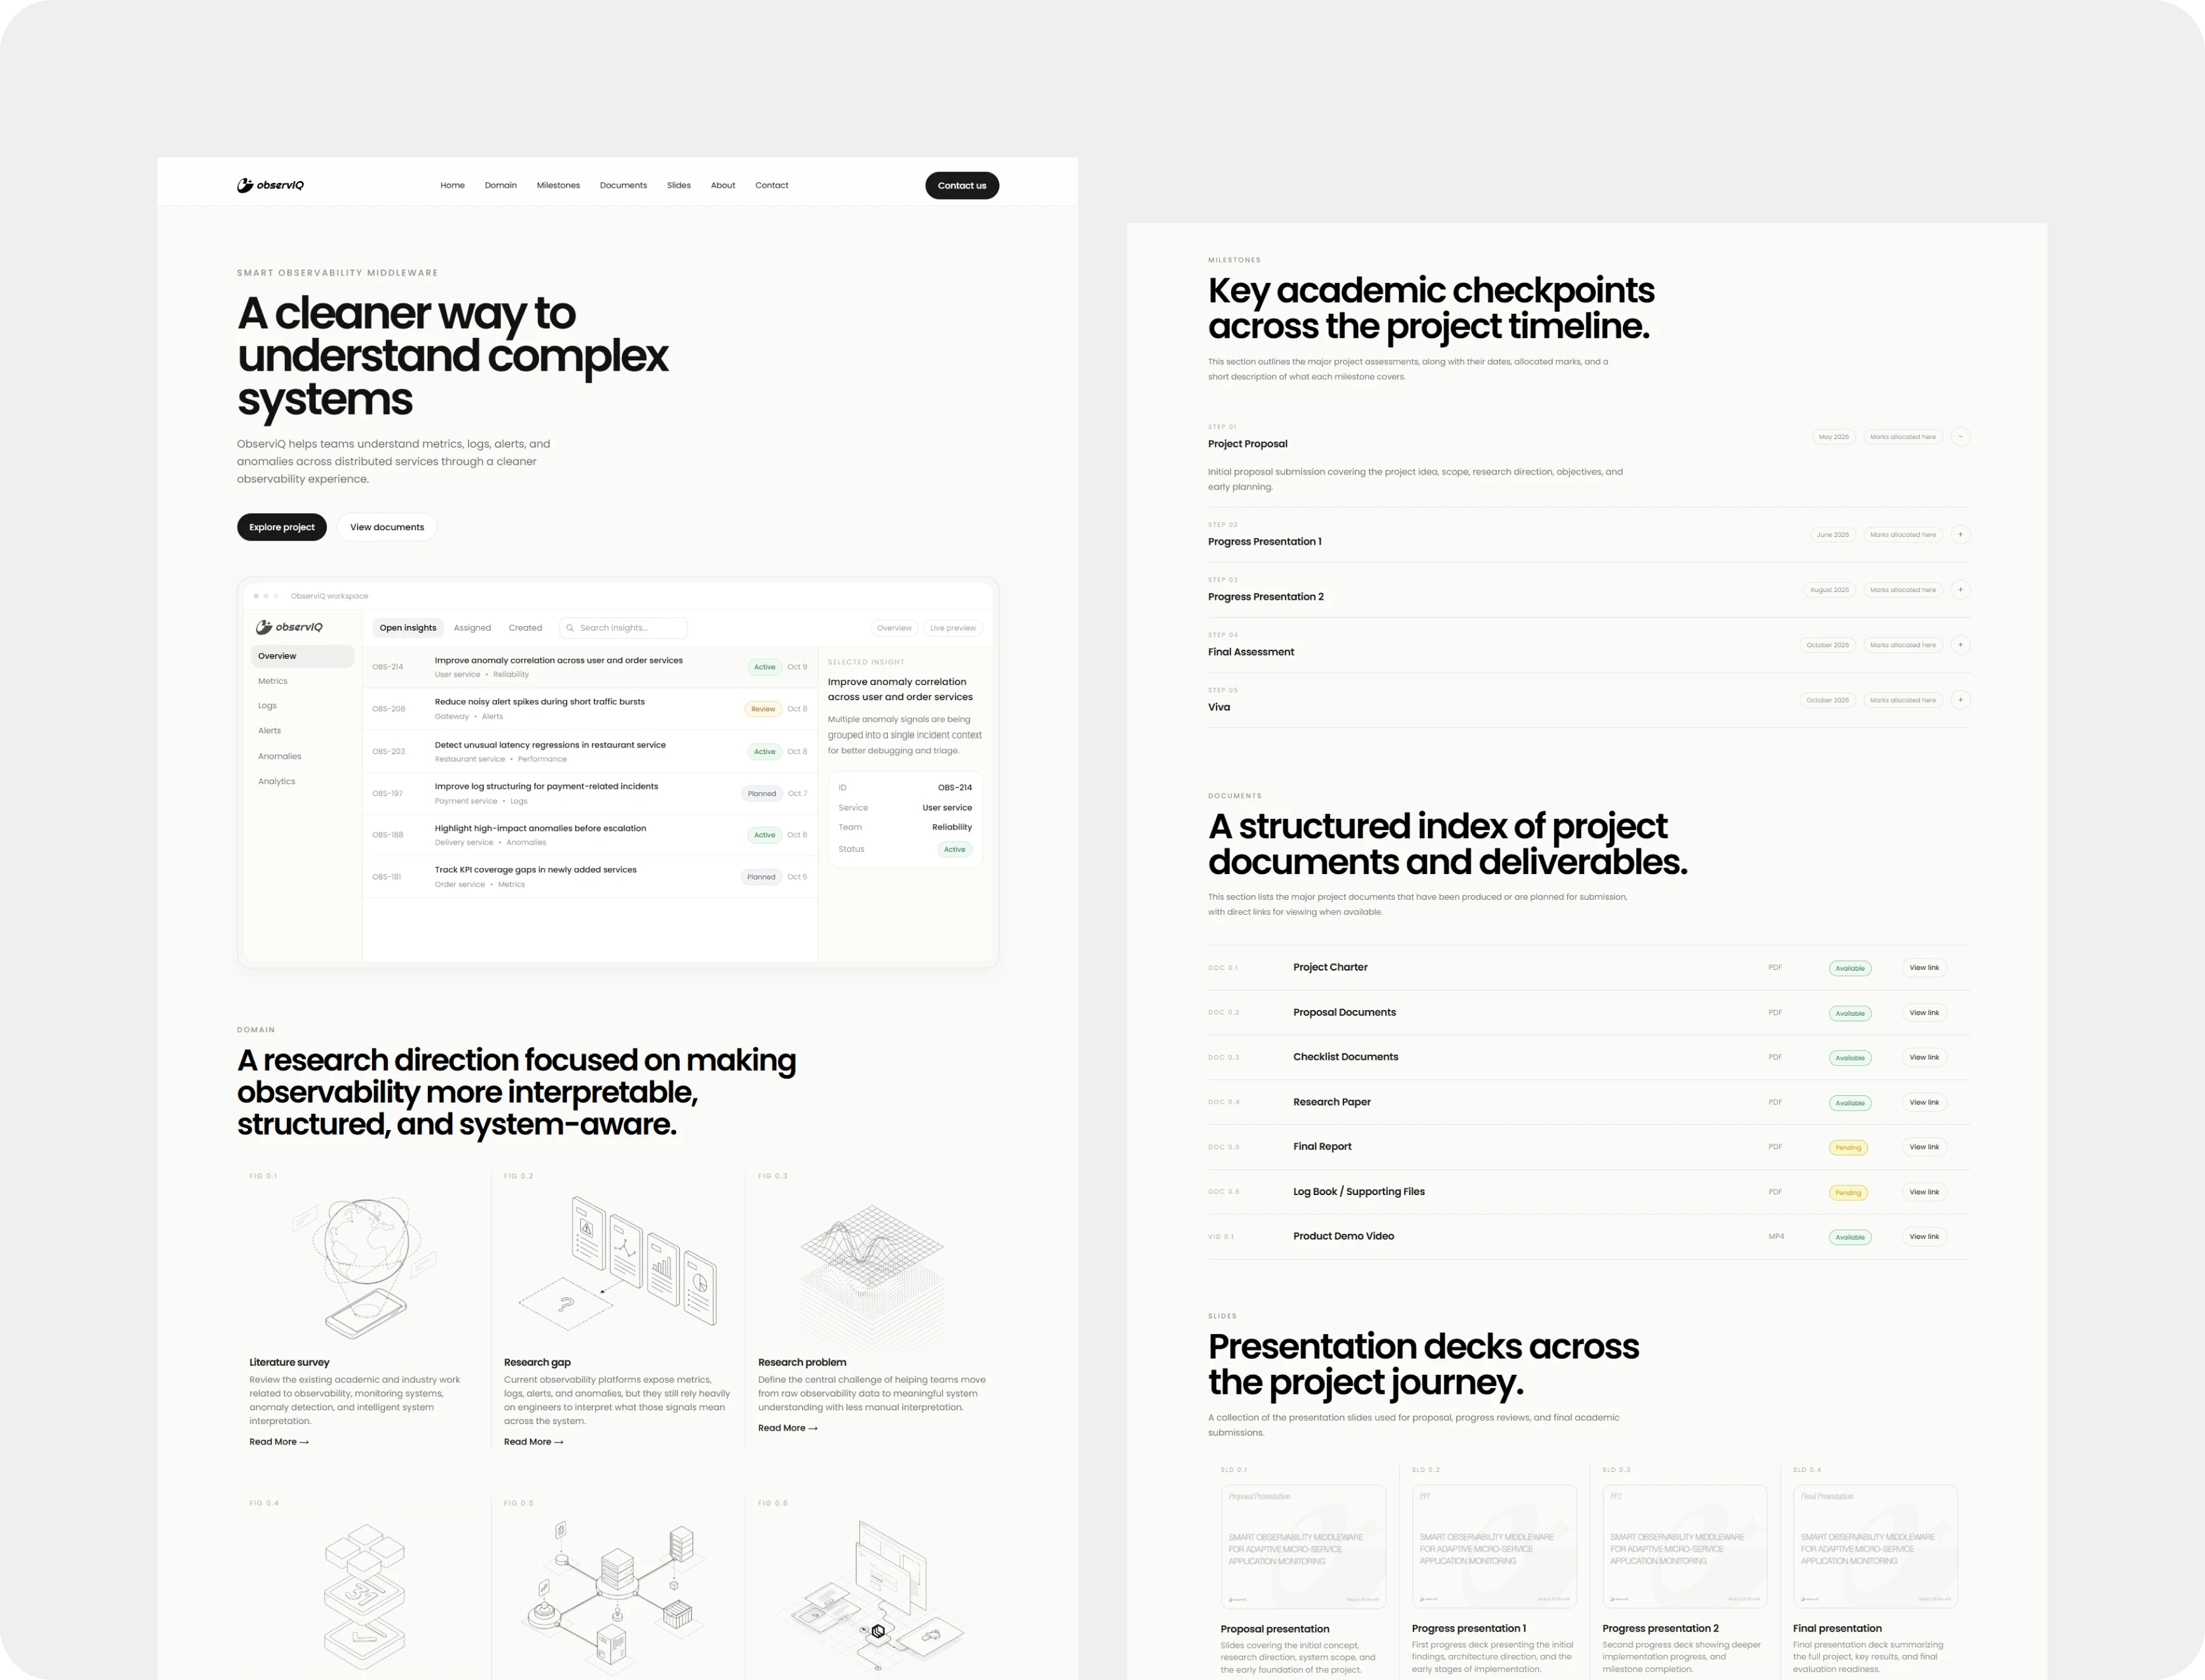
The website itself was structured to communicate this research journey through sections covering the literature survey, research gap, research problem, objectives, methodology, and technologies.
This allowed the website to work as more than a product landing page.
It became a digital representation of the entire research project.
Development
From design to a working experience
Once the visual system and interface were established, I translated the designs into a functional web experience.
The website was developed with a focus on:
Responsive layouts
Reusable components
Interactive navigation
Structured content
Visual consistency
Performance
Maintainable implementation
I also refined the interface directly during development, allowing design decisions to evolve based on how the experience actually felt in the browser.
The Final Experience
From raw observability data to system understanding
The final ObserviQ experience combines the research, product concept, visual system, and interface into one platform.
The result is an observability experience designed around a simple idea:
Complex systems don't need to feel complex.
The website communicates both sides of the project, the research behind ObserviQ and the product experience built around it.
Reflection
What I took away
ObserviQ was one of my opportunities to work across product design, research, information architecture, UI design, and development within the same project.
The biggest lesson was understanding that designing technical products isn't necessarily about showing more information.
It's about helping users understand the right information at the right time.
Working on ObserviQ also pushed me to think more deeply about hierarchy, data-heavy interfaces, system design, and how visual decisions can simplify complex technical concepts.
If you're looking for a designer who can take a project from concept and visual direction to a fully built digital experience, I'd love to talk.